Teacher Pay Data: Reviewing trends and a teacher’s spending power in different areas of the South
 SREB has updated their Teacher Compensation
Dashboard for a fourth year. With this many data, the trend
analysis is becoming clear:
- Salaries are rising at very slow rates.
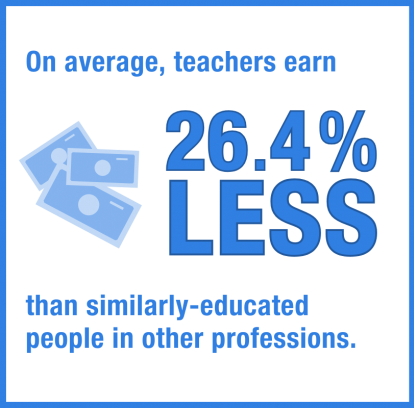
- The South remains 15% behind the nation in average salaries despite several states making modest pay bumps the last few years and the teacher wage penalty is up to -23.4% in the SREB region.
- Some states have worked to find cost savings for health care premiums while still offering several plan types or coverage options, lowering a teacher’s net pay.
- Most states in the region (10) do not offer an investment or hybrid pension-investment retirement option for teachers. Teachers who will leave the profession in seven years or less could save more in an investment plan and take that plan with them, further compounding savings options and cutting down on the state’s unfunded liabilities.
COVID-19 era federal funding is set to expire next year. Districts using that funding to cover teacher shortages are facing the impending stress of no longer being able to fill classrooms with temporary teachers, retirees or long-term substitutes paid for with this money.
 With continued
high competition in job markets and other industries raising
salaries and other perks to attract talent, the teaching
profession struggles to attract qualified, dedicated
professionals to enter or remain in teaching.
Teacher survey data year after year is clear – pay matters, but it’s not the only thing that matters. Many say they are willing to take less pay if working conditions, school culture and supports are positive or improving. However, when we dig down further, the surveys and interviews also reveal that teachers have a breaking point with pay – they must be able to support their family or they will find other work.
So how far does a teacher’s pay stretch? Reviewing different examples of average teacher pay on the district level along with local economic data helps us to better understand. SREB is now working to pull example rural, suburban and urban average teacher pay and benefits to calculate the average net, and then measure that up to the local cost index to analyze average spending power.
We hope this example data furthers the objective conversation on teacher compensation, inspires others to investigate the data in their own region, and helps lead to comprehensive solutions to teacher workforce shortages.

