Funding of Higher Education
Journal of Education Practices and Trends, July 2024

Post

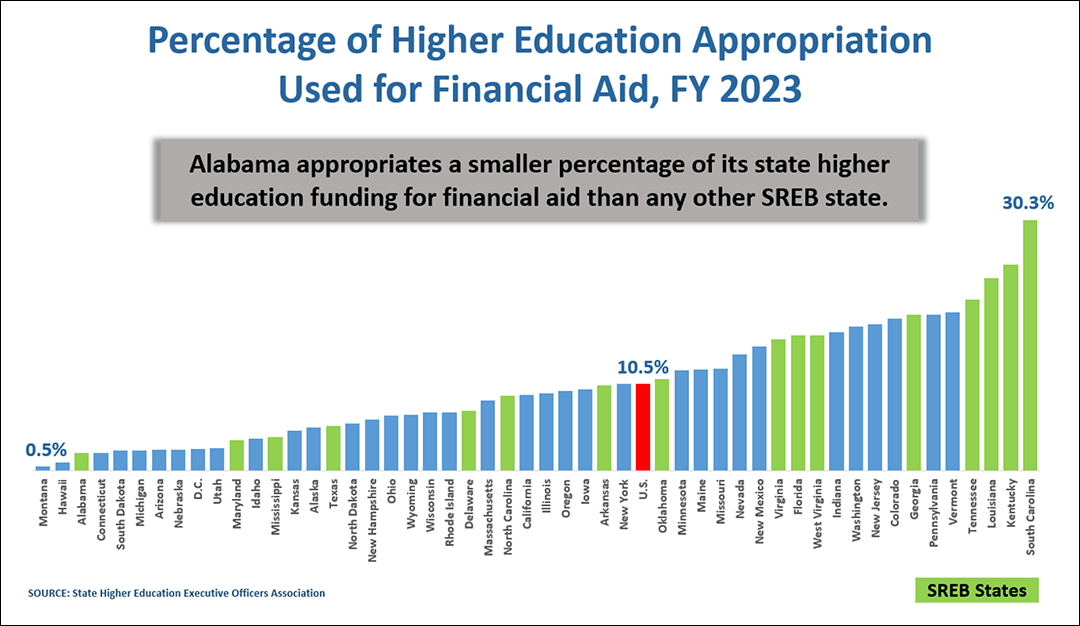
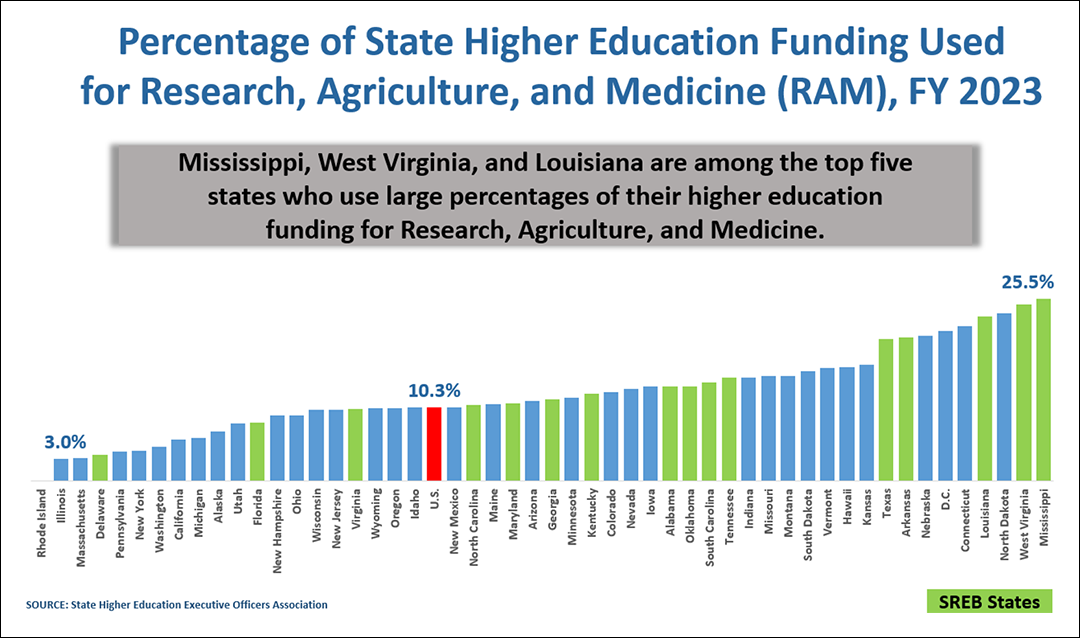
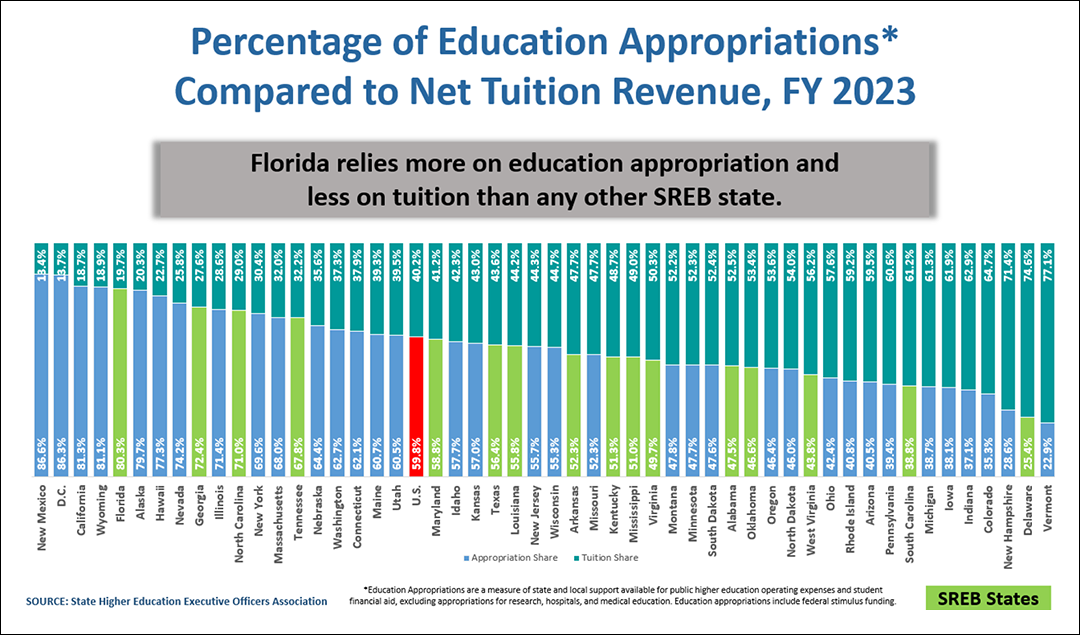
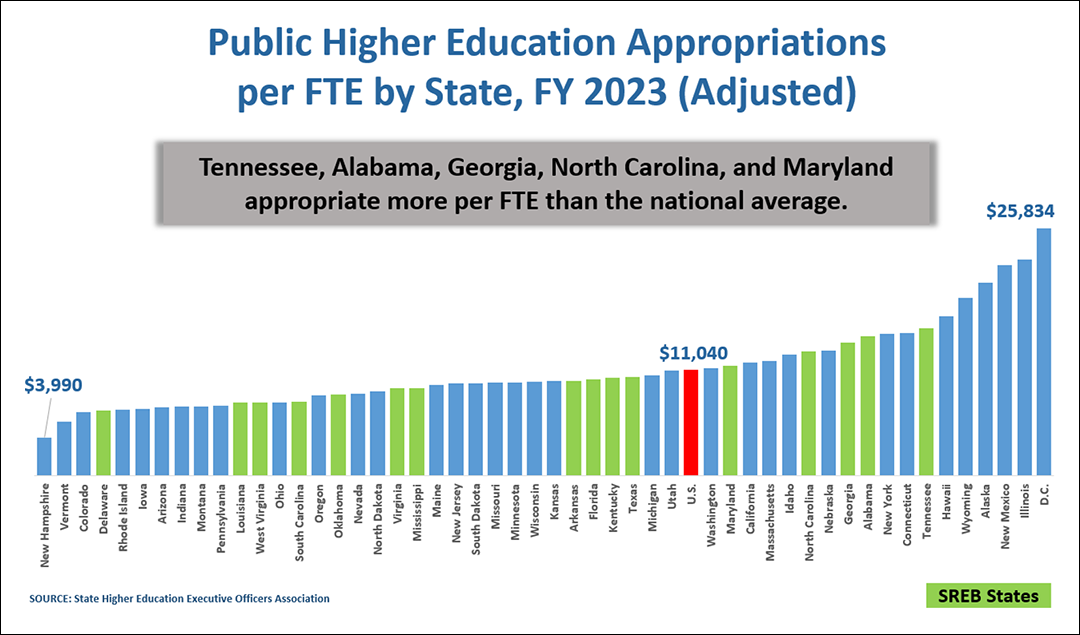
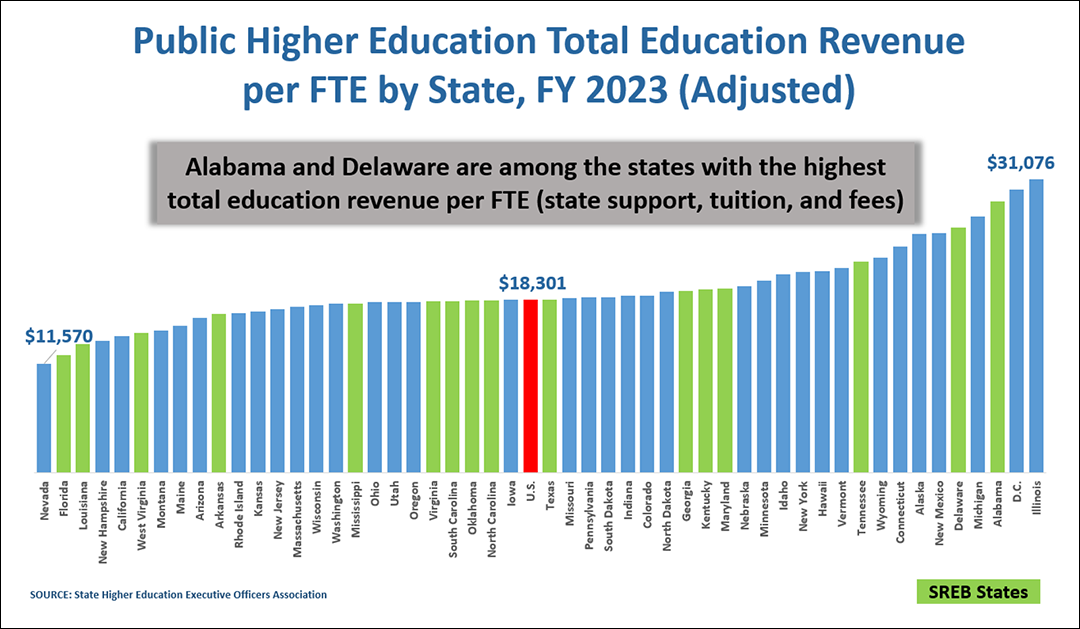
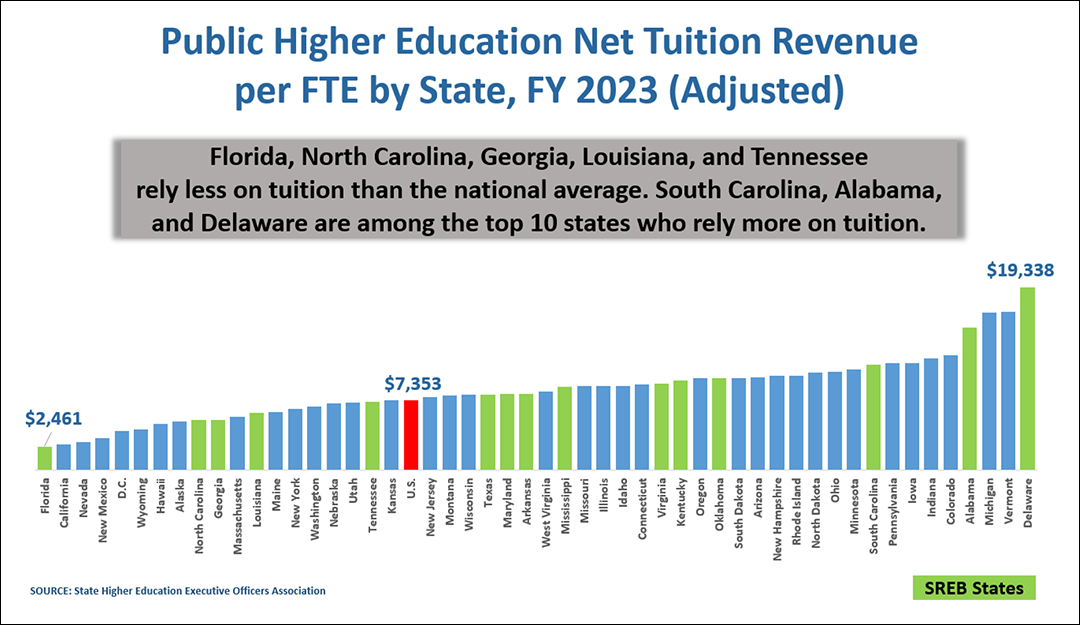
The State Higher Education Executive Officers Association releases the State Higher Education Finance (SHEF) report annually to enhance understanding of how public policy decisions in each state influence funding levels and distributions for public higher education, both within states and across the nation. The following charts offer comparisons of various data points across all states, with a focus on the SREB states, based on the 2023 SHEF report, which reflects data from the most recently completed fiscal year.

Title of First Image: Percentage of Higher Education Appropriation Used for Financial Aid, FY 2023. This bar graph illustrates the percentage of state higher education appropriations used for financial aid across various states for the fiscal year 2023. The graph shows a wide range of appropriations, with the lowest being Montana and Alabama at 0.5%, and the highest being South Carolina at 30.3%. The U.S. average (highlighted in red) appropriates 10.5% of its higher education funding for financial aid. States that are part of the Southern Regional Education Board (SREB) are highlighted in green. Source: State Higher Education Executive Officers Association. A text box in the center of the graph states: "Alabama appropriates a smaller percentage of its state higher education funding for financial aid than any other SREB state."

Title of Second Image: Percentage of State Higher Education Funding Used for Research, Agriculture, and Medicine (RAM), FY 2023. This bar graph illustrates the percentage of state higher education funding used for research, agriculture, and medicine across various states for the fiscal year 2023. The graph shows a wide range of funding, with the lowest being Rhode Island and the highest being Mississippi at 25.5%. The U.S. average (highlighted in red) funds 10.3% of its higher education funding for research, agriculture, and medicine. States that are part of the Southern Regional Education Board (SREB) are highlighted in green. Source: State Higher Education Executive Officers Association. A text box in the center of the graph states: "Mississippi, West Virginia, and Louisiana are among the top five states who use large percentages of their higher education funding for research, agriculture, and medicine."

Title of Third Image: Percentage of Education Appropriations Compared to Net Tuition Revenue, FY 2023. This bar graph illustrates the percentages of education appropriations compared to net tuition revenue across various states for the fiscal year 2023. The graph shows a wide range of appropriations, with New Mexico having the highest appropriation share of 86.6% and tuition share of 13.4% and the highest being Vermont having the lowest appropriation share of 22.9% and tuition share of 77.1% at 25.5%. The U.S. average (highlighted in red) has an appropriation share of 59.8% and tuition share of 40.2%. States that are part of the Southern Regional Education Board (SREB) are highlighted in green. Source: State Higher Education Executive Officers Association. A text box in the center of the graph states: "Florida relies more on education appropriation and less on tuition than any other SREB state."

Title of Fourth Image: Public Higher Education Appropriations per FTE by State, FY 2023. This bar graph illustrates the percentages of public higher education appropriations per FTE across various states for the fiscal year 2023. The graph shows a wide range of appropriations, with New Hampshire having the lowest appropriation per FTE at $3,990 and the District of Columbia having the highest appropriation per FTE at $25,834. The U.S. average (highlighted in red) has an appropriation per FTE at $11,040. States that are part of the Southern Regional Education Board (SREB) are highlighted in green. Source: State Higher Education Executive Officers Association. A text box in the center of the graph states: "Tennessee, Alabama, Georgia, North Carolina, and Maryland appropriate more per FTE than the national average."

Title of Fifth Image: Public Higher Education Total Education Revenue per FTE by State, FY 2023. This bar graph illustrates the percentages of public higher education total education revenue per FTE across various states for the fiscal year 2023. The graph shows a wide range of monetary values, with Nevada having the lowest total education revenue per FTE at $11,570 and Illinois having the highest total education revenue per FTE at $31,076. The U.S. average (highlighted in red) has a total education revenue per FTE at $18,301. States that are part of the Southern Regional Education Board (SREB) are highlighted in green. Source: State Higher Education Executive Officers Association. A text box in the center of the graph states: "Alabama and Delaware (SREB states) are among the states with the highest total education revenue per FTE (state support, tuition, and fees)."

Title of Sixth Image: Public Higher Education Net Tuition Revenue per FTE by State, FY 2023. This bar graph illustrates the percentages of public higher education net tuition revenue per FTE across various states for the fiscal year 2023. The graph shows a wide range of monetary values, with Florida having the lowest net tuition revenue per FTE at $2,461 and Delaware having the highest net tuition revenue per FTE at $19,338. The U.S. average (highlighted in red) has a net tuition revenue per FTE at $7,353. States that are part of the Southern Regional Education Board (SREB) are highlighted in green. Source: State Higher Education Executive Officers Association. A text box in the center of the graph states: "Florida, North Carolina, Georgia, Louisiana, and Tennessee rely less on tuition than the national average. South Caroline, Alabama, and Delaware are among the top 10 states who rely more on tuition."